
 MeshLine
Blog Analyze Tab or Content Performance Tab? Pick the Right First Check
Checking a blog post's performance in HubSpot? See which tab to open first so you can judge whether the post truly needs a refresh.
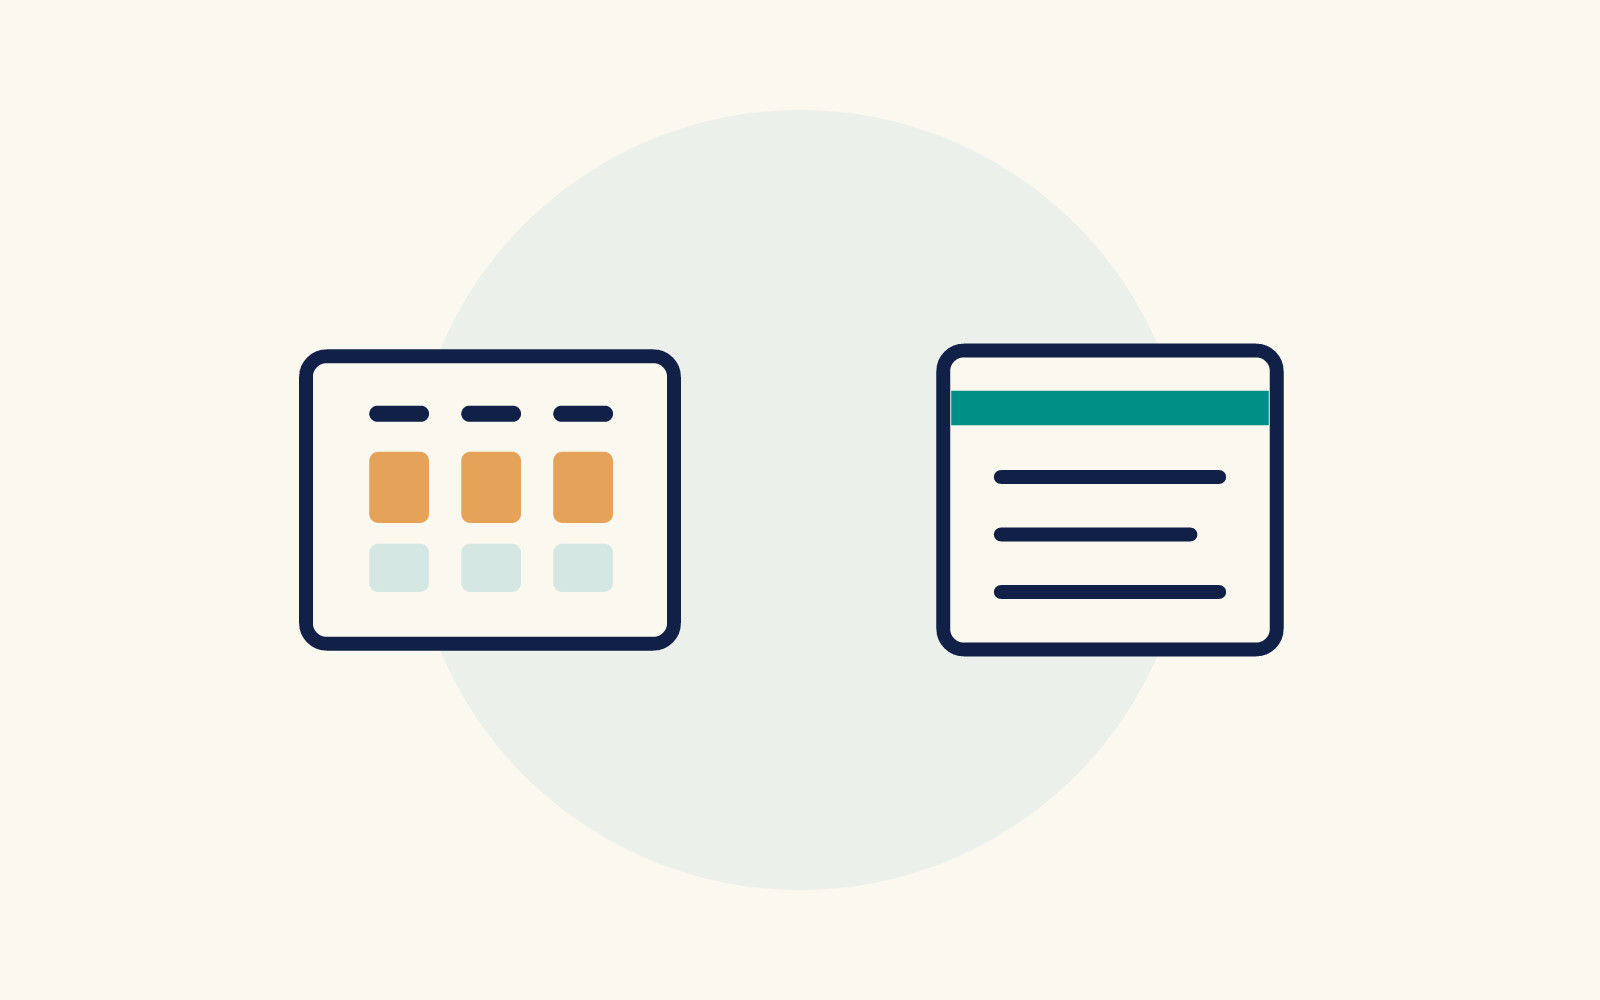
You have one blog post in front of you and a question to answer before it goes anywhere near a refresh queue.
HubSpot gives you two different places to look, and picking the wrong one first wastes time or, worse, leads you to a conclusion the data does not actually support.
The short version: the blog tool's Analyze tab answers how a post compares across your whole blog.
The individual content Performance tab answers how visitors engage with that one post, broken down by traffic source.
This article walks through what each surface documents, where each one falls short, and a simple order of operations for deciding whether a post deserves a refresh.
What the blog Analyze tab shows
The Analyze tab in the blog tool is a centralized view of how your blog posts are performing.
According to HubSpot's documentation, its default reports surface key metrics such as views, bounce rate and traffic sources. knowledge.hubspot.com
These help you identify top performing content, spot trends over time and understand where readers come from.
HubSpot lists these default reports:
- Blog post total views and bounce rate, including AMP views and the rate at which users view and then leave a post.
- Blog posts by view totals, a list of posts with the highest number of views.
- Blog post total views over time, compared to a previous period.
- Blog posts most recently published, with views, CTA clicks and CTA rates.
- Blog post visits over the last month broken down by traffic source.
You can also add advanced filters, for example filtering by a specific blog, and HubSpot notes you can add a custom dashboard to customize the Analyze tab beyond these defaults.
One prerequisite matters before you plan a review routine: HubSpot documents that View permission is required to analyze blog performance in the blog tool.
If a team member opens the tab and finds it unavailable, check their permissions before assuming anything about the data.
On availability, HubSpot lists the Analyze tab as available with any of the following subscriptions, except where noted: all products and plans.
Check your own account's plan details for any noted exceptions rather than assuming a specific feature is present.
What the individual content Performance tab shows
The Performance tab is per-content.
You reach it by navigating to Content and then Blog in your HubSpot account, hovering over the post and clicking Performance.
From there, the tab shows metrics such as page views, form submissions, new contacts and bounce rate, broken down by traffic source. knowledge.hubspot.com
The content metrics summary includes:
- Page views: how many times the content loaded in a web browser.
- Total form submissions: the number of form submissions on the content.
- New contacts: the number of new contacts created from this content.
- New customers: customers who originally converted on this content and currently have the Customer lifecycle stage.
- Average bounce rate: the percentage of sessions that started on this content and did not move to another page on your site.
- Time per page view: total viewing time divided by total views.
- Exits per page view and entrances.
Below the summary, a chart plots one metric over time broken down by source, and a source table lets you drill into each source's data.
You can edit the table's columns, selecting up to seven metrics at a time, and change the date range and frequency.
If the post includes smart content rules or videos, you can review how those perform as well.
Accounts with Marketing Hub Enterprise also have revenue attribution data based on interactions from contacts associated with closed won deals.
The documented metric nuances that matter before a refresh decision
Before you treat any single number on the Performance tab as a verdict, note the calculation details HubSpot documents, because they change what a metric means:
- Submissions from an embedded scheduling widget count in Total Form Submissions but not in New Contacts. A post with strong scheduling activity can look weaker on new contacts than it actually is.
- Time per page view does not include visitors who left the site after viewing only that content. Single-page readers are excluded from the average, so the figure describes engaged multi-page visitors, not everyone.
- Views and submissions from excluded IP addresses or referrers are not displayed in the totals. Internal traffic you have excluded will not inflate the numbers, but it also will not appear if you expect it.
- Bounce rate here measures sessions that started on this content and did not move to another page. A helpful post that fully answers a question can bounce heavily without being a failure.
These nuances are exactly why a refresh decision should not rest on one metric alone.
A low time-per-page-view figure paired with a high bounce rate might describe a post that answers quickly, or a post that loses people immediately.
The Performance tab gives you the pieces; interpreting them still requires judgment about what the post is supposed to do.
A decision rule for which surface to open first
Start from the question you are actually asking.
If the question is whether this post is underperforming relative to the rest of the blog, open the Analyze tab first.
Its default reports place the post among its peers: the posts-by-view-totals list shows where it ranks.
The views-over-time report shows whether the blog's overall trend is up or down.
The visits-by-source report shows where the blog's readers come from in aggregate.
Without that context, a post's raw numbers have no baseline.
If the question is how visitors engage with this one post by traffic source, open the post's Performance tab.
Only that surface documents the per-source breakdown of views, form submissions, new contacts and bounce rate for the individual post.
It also includes the drill-down table and the metric nuances described above.
In practice, the two questions usually come in sequence when a post is a refresh candidate.
A workable order:
- Open the Analyze tab and locate the post in the blog-wide reports. Note where it sits on views and bounce rate relative to other posts, and whether the blog's overall traffic trend is moving.
- Open the post's Performance tab and confirm source-level engagement. Check which sources send visitors, whether any source converts disproportionately, and whether the metric nuances above affect your read.
- Only then decide whether the post belongs in a refresh queue, and what the refresh should target.
Skipping the first step risks judging a single post only from its own numbers, missing the blog-wide comparison the Analyze tab documents.
Skipping the second risks the reverse: a post may look average in the blog-wide reports.
Its source-level engagement may tell a more specific story that only the Performance tab shows.
An illustrative walkthrough
Consider a labeled illustrative scenario, not a real customer result.
Suppose a post sits in the middle of the blog's posts-by-view-totals list on the Analyze tab, neither a top performer nor at the bottom.
On its own Performance tab, the source table shows organic search sending most visitors while another source sends fewer visitors but a higher share of form submissions.
That pattern mirrors the kind of source-level split HubSpot's own documentation example describes for a landing page.
It points to a different action than the view totals alone would.
The post may not need a traffic-focused refresh, but rather attention to how the converting source is being fed.
The point of the walkthrough is the sequence, not the numbers.
Blog-wide context first, per-post source detail second, decision last.
Where each surface stops
Neither tab is a complete answer on its own.
The Analyze tab's default reports are blog-wide; HubSpot notes they are the reports included by default and that you can customize the tab with a custom dashboard if you need more.
The Performance tab is deep on one item but says nothing about how that item ranks among your other posts.
For overall performance of a specific domain, HubSpot directs you to your marketing dashboard reports.
Alternatively, analyze performance for all pages or posts, rather than either of these two surfaces.
There is also a scope difference worth remembering: the Performance tab exists for individual pages, posts and case studies.
So the same per-content review habit extends beyond the blog if your refresh process covers landing pages too.
A short pre-queue checklist
Before adding a post to a refresh queue, run through this list:
- View permission confirmed for whoever is doing the review, since the blog Analyze tab requires it. The Performance tab's permission requirement is not documented in the supplied guidance, so check your account's settings before relying on it.
- Post located in the Analyze tab's default reports, with a note on where it sits among the blog's posts.
- Performance tab opened for the post, with the source table reviewed rather than just the summary totals.
- Metric nuances checked: scheduling-widget submissions, time-per-page-view exclusions, excluded IP filtering and what bounce rate measures here.
- A written note on what the refresh should target, based on the source-level evidence rather than a single metric.
This checklist can surface specific mismatches, such as a post whose summary totals look fine while its source table shows a converting source being neglected.
A checklist does not catch every judgment error in a refresh decision.
The interpretation step still depends on knowing what each post is meant to accomplish, so treat the list as a starting point rather than a complete review.
Keeping the review loop connected to operations
A per-post review is only useful if its conclusions reach the people who can act on them, whether that is a content owner, a paid media buyer or a sales enablement lead.
If your team coordinates content decisions across HubSpot and other tools, broader workflow context can help.
See automating HubSpot and Marketo for content operations or avoiding approval bottlenecks in blog publishing.
The habit itself is simple: match the question to the surface, respect the documented metric definitions, and write down what the evidence supports before a post enters the queue.
The two tabs answer different questions, and using them in the right order turns a vague underperformance hunch into a specific, checkable refresh decision.
How Meshline can help. Connect automation, Organic Marketing (demand generation), and customer lifecycle management (Revenue Intelligence).
Bring topic planning, content publishing and performance feedback into the conversation about your workflow. Book a Meshline demo.