
 MeshLine
Property or Page Aggregation? Read Search Console Totals Correctly
Confused by Search Console chart and table totals that disagree? Learn to tell property-level from page-level counting before you benchmark or report a figure.
You open the Search Console Performance report and see two numbers for the same site and the same period.
The chart says one click-through rate.
The table, grouped by page, says another.
The average position does not match either.
Nothing is broken, and no one changed the site overnight.
The two views simply count your results in different ways.
Before you use any figure from this report in a comparison, a refresh decision or a traffic-drop diagnosis, identify whether that figure is counted by property or by page.
This article shows you how each mode counts impressions, clicks and position, when the two views diverge, and a short check to run before you act on a number.
Why the same site shows two different totals
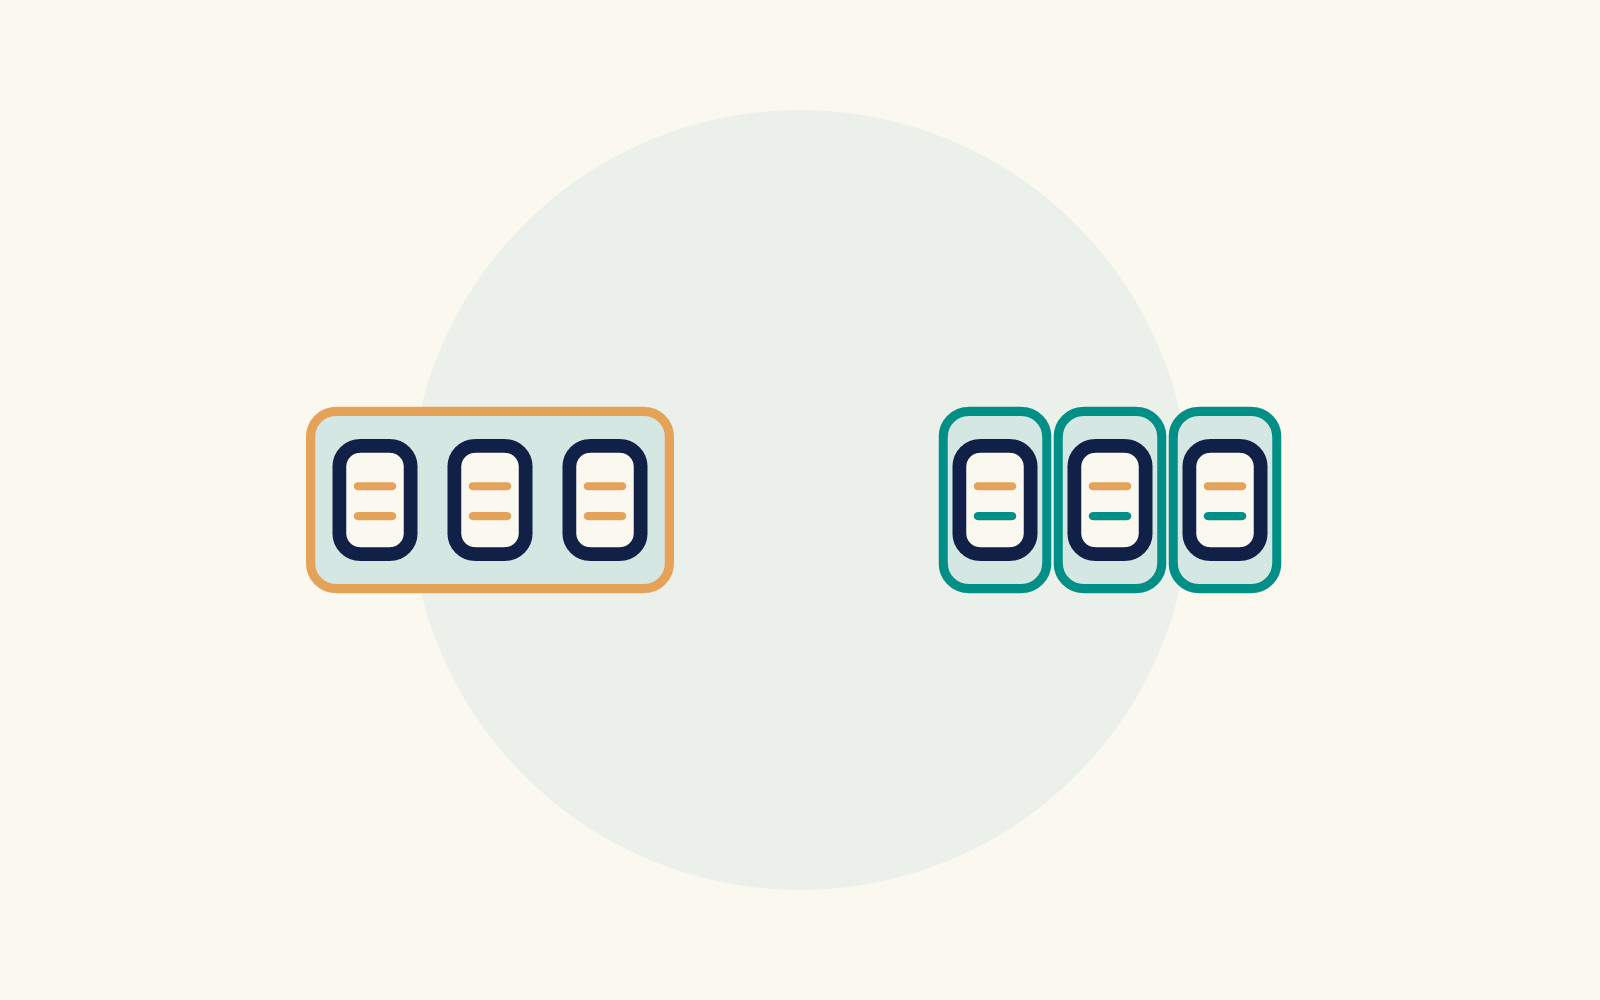
The Performance report aggregates data in one of two ways: by property or by page.
The chart at the top of the report aggregates by property.
The table below it aggregates by page whenever you group by page or by Search appearance.
That is the documented behavior of the report, not a glitch in your account.
Because the counting methods differ, the same underlying search activity produces different totals in each view.
If your site often appears more than once on a results page, the gap between chart and table can be large enough to change how you read performance.
Knowing which method sits behind the figure in front of you is the first step in interpreting it correctly.
How each aggregation mode counts your results
When data is aggregated by property, all results for the same query that point to the same Search Console property are counted once in total.
If your property appears twice on a results page, that counts as a single impression.
If a user clicks one link, backs up, then clicks a second link from the same property, that counts as a single click.
For position, the report shows the topmost position of your property in the results.
When data is aggregated by page, each unique URL in a search result is counted separately, even when the URLs point to the same site.
Each unique page gets its own impression.
If a user clicks one link, backs up, then clicks a second link from the same site but a different URL, that counts as two clicks, because each unique URL is counted separately.
Position reflects the topmost position of that specific page.
A worked illustration from Google's documentation
Google's own support.google.com documentation includes an example that makes the difference concrete.
Imagine a search where the only three results all come from the same property: a monkeys page, a ponies page and a unicorns page on one site.
One user sees this set of results and clicks each of the three links.
Aggregated by property, the report shows a 100% CTR, because all clicks for the site are combined.
Average position is 1, the highest position from the site in the results.
Impressions count as 1 for the property.
In the page-aggregation column of this worked example, Google reports 33% CTR per URL.
The example reports average position 2 by averaging positions one, two and three. That average does not assign rank 2 to each result.
Impressions count as 1 for each URL.
Same user, same clicks, same results page — three different-looking metrics depending on the counting method.
This is a labeled illustration of Google's documented example, not a customer result, but it shows exactly why chart and table figures can disagree for a single site.
When property-level figures diverge from page-level figures
The documentation states a directional condition.
CTR and average position are generally higher when aggregating by property.
This applies when multiple pages from the same site appear in the search results.
The reason follows from the counting rules.
Only the topmost position is reported for the property, and all impressions count as a single impression for the property.
That condition is something to verify against your own situation, not a target to expect.
Ask yourself, before interpreting a gap between chart and table: do multiple pages from my site commonly appear for the queries in question?
If yes, expect the property-level view to look stronger on CTR and position than the page-level view.
For queries where only one of your pages appears, check whether the two views are closer in your report.
Verify that expectation against your own data, and treat a large gap as something else worth investigating.
Also note what the condition does not say.
It does not promise any specific numeric difference, and it does not mean the property-level figure is more accurate.
Each view answers a different question.
The property view describes how your site as a whole appears in results.
The page view describes how each individual URL performs.
A short check before you compare or benchmark
Run this check whenever you are about to compare chart totals to table totals, benchmark a content change, or report a figure to stakeholders:
- Identify the counting method behind the figure. Chart data is aggregated by property. Table data grouped by page or Search appearance is aggregated by page.
- Check whether multiple pages from your site appear for the queries involved. If they do, expect CTR and average position to read higher in the property-level view, per the documented condition.
- Compare like with like. When benchmarking a specific page's change, use page-level figures. When reporting overall site presence, the property-level chart is the matching view.
Two data conditions can also affect the figure you are reading.
First, the newest data in the report is sometimes preliminary: it is still being collected and may change in the next few hours.
Preliminary data appears on the chart with a dotted line.
It only shows when you explicitly choose a day with preliminary data.
That is usually today's data, and sometimes yesterday's, in the date-range selector.
If your comparison includes the most recent day, treat those figures as provisional.
Second, if you export the report, both chart and table data are included in the export.
Values shown as ~ or - in the report, meaning not available or not a number, become zeros in the downloaded data.
If downstream calculations treat those zeros as real observations, averages and totals in your spreadsheet can be distorted.
Check how your reporting tool handles those substituted zeros before drawing conclusions from an export.
Applying the check to common reporting situations
Suppose a stakeholder sees the chart showing a healthy CTR and the table showing a much lower one, and asks which number is right.
Both are right; they answer different questions.
The chart describes the property's overall presence, combining duplicate appearances into one impression and reporting only the topmost position.
The table describes each URL separately.
Explaining the counting method addresses the likely cause — different counting rules — before assuming a data error.
Suppose you refresh a page and want to know whether its position improved.
The property-level chart is the wrong lens if other pages from your site also rank for those queries, because it reports only the topmost position of the property.
Use the page-level table for that specific URL instead.
Suppose you are diagnosing a traffic drop.
Knowing the aggregation mode helps you rule out one false lead.
A chart-versus-table divergence can follow the documented directionality condition.
In that case it is an expected artifact of counting, not evidence that something changed on the site.
If the gap does not fit that pattern, keep investigating other causes.
None of these checks requires new tooling.
They require only that you pause and confirm which counting method produced the number in front of you before you act on it.
Where to record what you find
If you annotate refresh dates or reporting changes, note the aggregation mode alongside the date so future readers of your report know which counting method produced the baseline.
Building a broader monitoring routine?
The guide on why AI content needs Search Console feedback covers how performance signals feed content decisions.
The Search Console definition for SEO operators frames the report's role in an operator workflow.
The figure in front of you is only as interpretable as the counting method behind it.
Confirm property versus page aggregation first; then compare, benchmark or diagnose.
How Meshline can help. Connect automation, Organic Marketing (demand generation), and customer lifecycle management (Revenue Intelligence).
Bring topic planning, content publishing and performance feedback into the conversation about your workflow. Book a Meshline demo.